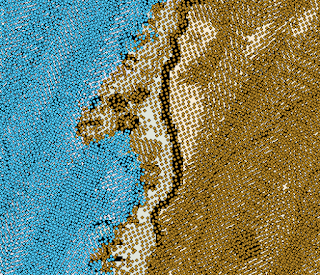
Here you can see the transition from depth soundings (blue) to terrain heights (brown) from the LADS lidar system. The flightlines are oriented north-northeast by south-southwest. NOAA chart 13283 is peeking out from behind the soundings. You can just see how the transition in sounding type roughly follows the foreshore line (MLLW) on the chart.

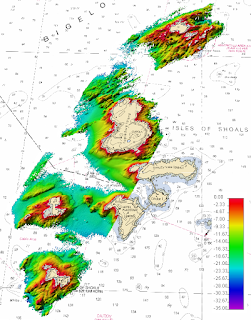
What does the bathymetry from the LADS MKII lidar look like? Here's a peak of some of the lidar bathy data (blue soundings only) gridded at a 4-meter resolution and displayed in Fledermaus. Sun illumination is from the northwest and the vertical exaggeration is 3. NOAA chart 13283 is in the background.


No comments:
Post a Comment