Okay, so while Excel2Latex works great on my PC at school, it does not work so hot on my Mac running Excel 2004. TexShop was not happy with the output code at all. I tried some tips I found online, but no luck. Then I came across:
Cal2LaTex for OpenOffice and NeoOffice. This tool works like a charm and its menu options are superior to that of Excel2Latex. It did take me a few minutes to figure out how to assign the Macro its own listing under my Tools menubar, but other than that getting it working was a breeze.
And let's face it, on a Mac at least, NeoOffice seems to run better than MS Office anyway. Of course, since I discovered LaTex I generally only ever open Word when I have to open someone else's document. :)

Friday, May 29, 2009
Tables in LaTex Made Easy!
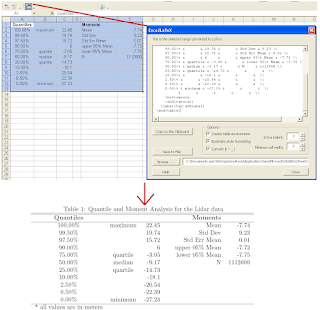
Tables in Latex can be rather tricky, and I wanted to find some way of creating a table quickly that would look good. In Googling around, I stumbled across Excel2Latex. This little macros tool will add a toolbar button that will allow you to export directly from a table you have formatted in Excel (Mac or PC versions) into a piece of Latex code that can be pasted into you Tex document. Once in Tex, you can add some snazzy formatting (like lines, etc.) and you are all set. Excel2Latex will even convert all font formatting (bold, italic, etc.) for you.
Check out the results (I used /hline to add some lines to the original exported code):
Note: I did have some troubles running the macros at first. I kept getting: "Error: Can't find project or library."
The Solution: Open your VBA editor in Excel (from Excel hit alt+F11) and then go to Tools -> References. Scroll down until you see the reference labeled MISSING and simply uncheck it.
The tool should now work.
Check out the results (I used /hline to add some lines to the original exported code):

Note: I did have some troubles running the macros at first. I kept getting: "Error: Can't find project or library."
The Solution: Open your VBA editor in Excel (from Excel hit alt+F11) and then go to Tools -> References. Scroll down until you see the reference labeled MISSING and simply uncheck it.
The tool should now work.
Monday, May 25, 2009
Seamless land/sea mapping with Lidar
I am currently working up some Tenix LADS MKII lidar data over the Isles of Shoals off the coast of New Hampshire. I must say, the data set is quite impressive. Not only does the lidar bathymetry match very well with EM3002 multibeam bathymetry we have in the same area (initial comparison shows a mean difference of 0.6 m w/ a std: 0.3 m), but the seamless transition of the lidar data from water to land follows very closely the transition between the foreshore and the water (soundings are reduced to MLLW).
Here you can see the transition from depth soundings (blue) to terrain heights (brown) from the LADS lidar system. The flightlines are oriented north-northeast by south-southwest. NOAA chart 13283 is peeking out from behind the soundings. You can just see how the transition in sounding type roughly follows the foreshore line (MLLW) on the chart.
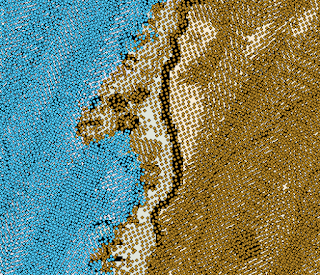
What does the bathymetry from the LADS MKII lidar look like? Here's a peak of some of the lidar bathy data (blue soundings only) gridded at a 4-meter resolution and displayed in Fledermaus. Sun illumination is from the northwest and the vertical exaggeration is 3. NOAA chart 13283 is in the background.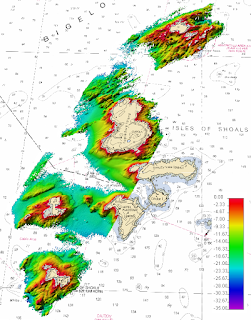

Friday, May 8, 2009
LIDAR view of the Golden Gate Bridge
The Seafloor Mapping Lab at the California State University in Monterey Bay has recently obtained a new vessel-mounted Lidar system for shoreline surveys. From their website:
Integration of this technology with their existing mapping systems allows for some pretty impressive data displays:
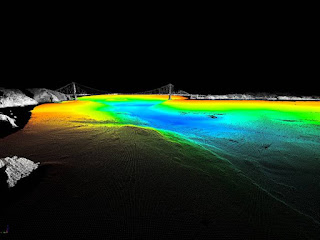 Combined bathy/topo DEM of the Golden Gate built by merging SFML's laser scanner (gray) and multibeam sonar (colored by depth) data (source: http://seafloor.csumb.edu/laserscanner.html)
They also have some pretty sweet 3D fly-throughs of the Golden Gate Bridge and the Los Padres Reservoir. I have included their Golden Gate Bridge fly-through below:
The high-resolution data set seen above was collected using SFML's new vessel-mounted mobile marine LIDAR system. Working with our industry partners, Riegl and Applanix, we have implemented an easily and rapidly deployable laser scanner capable of achieving decimeter accuracy with sub-meter resolution at a 1 kilometer range. This system gives SFML the ability to map the intertidal shoreline, offshore rocks and pinnacles and coastal features in unprecedented detail without the need for more costly airborne LIDAR surveys. The high spatial precision and accuracy of the system enable SFML to reliably monitor and quantify coastal erosion and landslide rates, bridge deformation, railway subsidence and coastal highway slippage through repetitive shoreline mapping surveys; information critical to coastal communities as they plan for climate change and sea level rise.
Integration of this technology with their existing mapping systems allows for some pretty impressive data displays:
 Combined bathy/topo DEM of the Golden Gate built by merging SFML's laser scanner (gray) and multibeam sonar (colored by depth) data (source: http://seafloor.csumb.edu/laserscanner.html)
They also have some pretty sweet 3D fly-throughs of the Golden Gate Bridge and the Los Padres Reservoir. I have included their Golden Gate Bridge fly-through below:
Subscribe to:
Posts (Atom)