My friend Christiana pointed me to the new Radiohead video that used lidar technology to create various 3D models of people and terrain . The whole video is simply a composite of these data. It all appears to be terrestrial lidar, but it is still pretty sweet!

Tuesday, March 24, 2009
Monday, March 23, 2009
How to create an outline of your data in ArcMap
Recently I had some XYZ data gridded up in ArcMap, and I wanted to create a simple outline of it. I could not, for the life of me, figure out how to do it, save digitizing the entire thing myself. Luckily, someone showed me a very valuable trick, and I now know there is a quick way to do it, though this method is by no means straight forward:
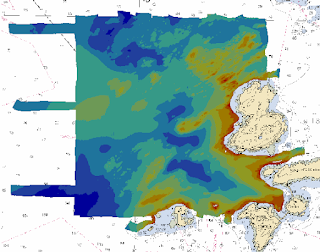
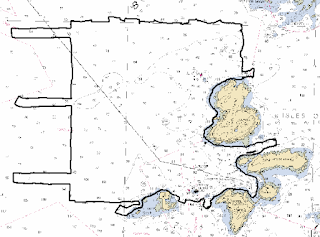
- create a raster of your data. Whether you chose natural neighbors, an IDW grid, whatever, does not matter. Any resolution that will not exaggerate you data coverage will work.
- use raster calculator to convert this grid to an integer grid. You can use Raster Calculator under the Spatial Analyst tool and simply multiply your grid by 0. You need to put your expression between parentheses, with an "int" in front. For example: [mb_int_grid] = int([mb_grid] * 0)
- Also under Spatial Analyst, use the Convert Raster to Features to convert your integer grid to a polygon.
- You can now alter your polygon symbology to give you a nice outline.
Below you can see my original gridded data and the resulting outline.
Saturday, March 14, 2009
Udel AUV in Second Life
Art Trembanis gave a great seminar yesterday about some of the AUV development and research going on at the University of Delaware. He mentioned that UDel had actually set up some property in Second Life, and that users could come and check out the new Gavia-class AUV that will soon be undergoing sea trials. I decided to join Second Life myself (membership is free) and check out what UDel had to offer. Below are two screen grabs where you can see me checking out the AUV as well as UDel's research vessel.


Sunday, March 8, 2009
Modeling a Lidar System: Part 1
Now that I am really starting to get into my research with lidar systems, I feel that it is important to understand as many of the intricacies and nuances of the system as possible, and how they interact with each other. Although I am certainly learning a lot from reading countless articles and texts, and having great directed study sessions with my chairs, I feel one of the best ways to learn is through a more experiential approach. Since I do not have full-fledged lidar system at my disposal to fly around with and image things (anyone offering?), I figure the next best thing I can do is theoretically model the system.
To get myself started, I found a paper by H. Michael Tulldahl and K. Ove Steinvall entitled: "Analytical waveform generation from small objects in lidar bathymetry," (App. Optics, v.38 n.6, 1999). The authors present a model to simulate received lidar waveforms in order to observe the influence of variously-shaped objects on the seabed. I am tweaking the modeled system parameters to match those of the systems I am working with, as well as the water-dependent parameters to match different water types. I am also not dealing with any objects on the seabed, and for now am assuming a flat bottom. I have only just started, so my model is nowhere near complete. Although this model is not the primary focus of my research, I see it as a way to help me understand not only what I am seeing in the data, but also predict features in the data that I might look for. Eventually I would like to have a user interface where I could simply select the lidar system and approximate water type (most likely based off Jerlov), and perhaps bed type and approximate roughness, and just hit "go!"
The model is currently in Matlab, though as it develops I may switch to a more object-oriented scripting language such as Python (I can hear Kurt applauding from here). The point is, models (and the more specifically, the development of models) can be a powerful learning tool. I wish that modeling itself (or at least an introduction to modeling) was taught as more of a core research tool, opposed to a special one.
Below is a snippet of some of the model output as it now stands. The top graph shows the volume backscattered power reaching the receiver. The middle graph shows the amount of power incident on the seabed (one-way travel), and the bottom graph shows the percentage of transmitted power returned to the receiver, all as a function of depth. In this case, the off-nadir angle of the laser is 0 degrees and I am looking only at the nadir beam. I am assuming pure seawater (just to make my initial attempts a little easier) and treating the water surface return of the green wavelength and the atmospheric loss as negligible.

Thursday, March 5, 2009
Sun Illumination in 3D Imagery: why 2 views are better than 1
Sun illumination is one of the key concepts in 3D imagery. Depending what illumination angle you chose, certain features will either be highlighted or muted. Bad data can often be made to look good, and good data can certainly be made to look bad. One popular convention (or at least one I heard a lot back when I first started doing all this) is to simply illuminate everything from the northeast (45°). Another is to illuminate perpendicular to the features you wish to highlight. Recently, it has become common to provide two different images or scenes with two opposing sun illumination angles, so that the end-users can get a better sense of the data quality. I was thinking about all this this morning as I was working with some lidar data. Below are two 3D images of some lidar data I am working with rendered in Fledermaus. All the input parameters for the sun illumination were kept exactly the same, and only the illumination angle was changed. In the first image, the data is illuminated from the northeast (45°), while in the second, the data is illuminated from the southwest (225°). Note the dramatic differences.


At 45°, the imagery looks quite nice and the rocky areas are clearly delineated.
At 225°, the imagery still looks nice, but now you can also see linear NE-SW trending features in the data. These features could be real, or they could be artifacts in the data. Either way, if I had only rendered the data at 45°, I never would have seen them.
Here is a side-by-side comparison of the two illuminations:
Now that I have seen the linear features in the second view (225°), I can just start to make them out in the first one (45°), but they are still hard to see. By looking at different illumination angles, I can really start to get an idea of features and trends in the data, as well as any artifacts.
Wednesday, March 4, 2009
ClamAV: Easy Antivirus on the Mac
We all know Macs are less susceptible to malware and viruses, but that does not mean it isn't good to check your system from time to time. I go back-and-forth between my Mac and my Windows machine at school all the time. Even if my Mac is safe, I do not want to potentially carry something over to my Windows machine and vice-versa. Also, given that I have recently discovered the Vuze BitTorrent client, I like to know that the files I have grabbed are safe.
ClamAV is a UNIX-based open-source anti-virus client, particularly designed (but not limited to) email scanning. I installed it via fink and run it via command line. It is really easy to scan individual files, directories, or your whole machine this way. I recently did a scan of my whole home directory, and true to its speciality, it detected two potential problems, both email phishing attempts (for some reason, our school servers get tons of email from people asking for help with 10 million dollar deposits):

ClamAV is a UNIX-based open-source anti-virus client, particularly designed (but not limited to) email scanning. I installed it via fink and run it via command line. It is really easy to scan individual files, directories, or your whole machine this way. I recently did a scan of my whole home directory, and true to its speciality, it detected two potential problems, both email phishing attempts (for some reason, our school servers get tons of email from people asking for help with 10 million dollar deposits):

Tuesday, March 3, 2009
Happy Square Root Day!
Just came across this and found it humorous:
http://en.wikipedia.org/wiki/Square_Root_Day
Of course, now I have missed my chance to take a Square Root Day holiday until 9/9/2081.
http://en.wikipedia.org/wiki/Square_Root_Day
Of course, now I have missed my chance to take a Square Root Day holiday until 9/9/2081.
Subscribe to:
Posts (Atom)