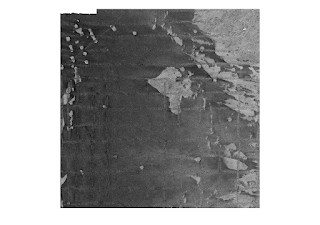
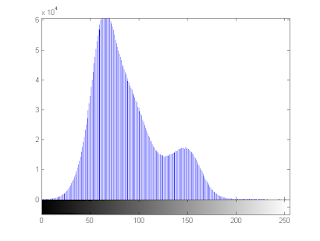
One of the first things I tried was the histogram function "imhist", to see how spread out my pixel values were between 0 - 255. Clearly my image does not make use of the full range of colors.
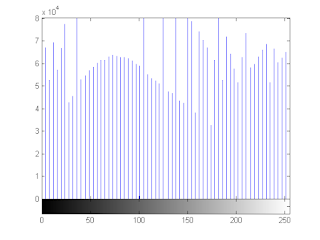
 I then used "histeq" to stretch the intensity values between the full range of colors. Below are the resulting histogram and new higher contrast image.
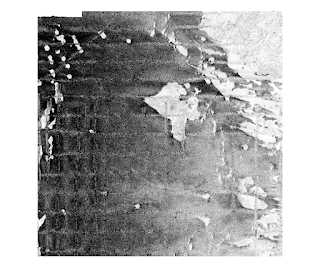 You can clearly see the artifacts from the nadir beam of the sonar where you get a brighter return. I figured this would be a good test of one of the edge detect algorithms to see if it picks them all out. I used the "edge" command and specified the Sobel method, leaving the threshold value blank. You can also specify a direction, however, I left it as the default, which looks for both horizontal and vertical edges. Here are the results:
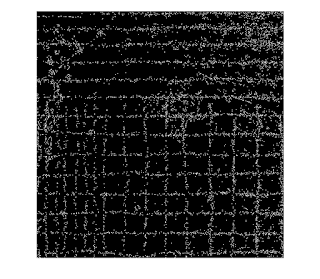 Pretty cool. It almost looks like a trackline map of the survey!

No comments:
Post a Comment