First I installed MB-System using Fink. If you have not heard of Fink, check it out here. It packages up open-source unix programs and compiles them to run on a mac. The only incompatibility as of now is that the MB-System grid viewer is not supported by Fink due to an issue with OpenGL and some differences in the naming conventions between the OS X 10.4 and 10.5 environments, but it is currently being worked on. Once I had fink installed and updated, I simply ran:
$ fink install mbsystem (for me, the dollar sign is my command prompt)
I decided to test out MB-System with a single data file from my summer hydrographic field course. First I ran mbinfo to get an idea of the scope of the data I was dealing with:
$ mbinfo -I 0162_20080616_161142_RVCS.all
This provides a neatly organized output that includes navigation info, start and end info (times, lat, long, depth, etc.), total number of pings, etc.
Another good thing to check early on in your processing is the navigation, which can be done using mbnavlist:
$ mbnavlist -I 0162_22080616_161142_RVCS.all
This command can be modified to display different data, but by default it displays date and time, unix time (in decimal seconds), longitude, latitude, heading, and speed.
The next tool I ran was mbm_plot, so I could look at the line an see what it looked like:
$ mbm_plot -I 0162_20080616_161142_RVCS.all
this command generates a .cmd file that contains all the necessary commands to generate a postscript file and display it using ghostview. To run the command:
$ ./0162_20080616_161142_RVCS.all.cmd
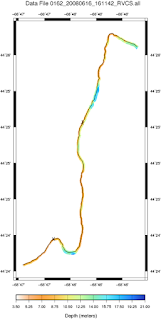
Since I do not have ghostview, I get a small error message which I ignore and just run the open command to view it in Preview. The last command simply plotted the navigation trackline, but now say I want to see what the actual bathymetry looks like. I can run mbm_plot again and indicate that I want to use a color-fill of the bathymetry by using the graphics mode (-G). I can also specify to overlay the trackline by adding -N:
$ mbm_plot -I 0162_20080616_161142_RVCS.all -G1 -N
Again, a .cmd file is generated that I can run to plot the data and view it. The mbm_plot function utilizes GMT to create the plot and handle the axes. You can customize mbm_plot quite a bit, but aside from specifying color-fill and navigation, I left mine at the default settings. Here is the result:
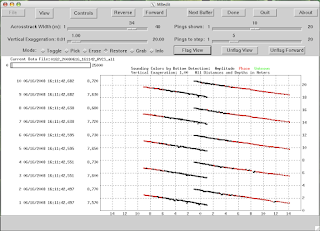
 In order to edit the actual pings, you use a command called mbedit. Right now you can only edit using a 2D viewer, but there is a 3D MB-System editor in the works (it is currently in a beta version now). To open up mbedit for the line, I simply ran:
$ mbedit -I 0162_20080616_161142_RVCS.all
I could also have just opened mbedit by itself and then opened the line file from within the program. In mbedit you can apply filters to blank out the outer beams, flag bad data points, edit individual beams and pings, etc. There are many different view options in mbedit that makes examining the data fairly easy. In the example below I am using the waterfall display with the option to color by bottom detection algorithm turned on. The data was collected with a Simrad EM3002 dual-head system, and the waterfall displays enables you to see the individual pings of each transducer. Red beams are phase-detected and black are amplitude-detected.

These tools represent only a few of the things that MB-System can do. To really get a sense of it all, you need to check it out for yourself. I highly recommend Val Schmidt's MB-System Cookbook as a must-have manual.
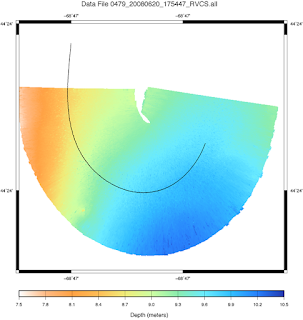
So far, the only quirk I have noticed with editing my data in MB-System is that when I plot it, it appears that the actual ping data and the navigation data start and stop at different times. It is hard to see in the plot figure above, but you can clearly see it in the plot of a turn line below. This could be due to how MB-System handles the extrapolation of the navigation data for Simrad systems, or it could just be something weird on the Simrad side. Simrad does not store navigation for each individual ping, so it is possible to have pings without nav and vice-versa. Kurt looked at some Hydrosweep data in MB-System (Hydrosweep does store nav data for each ping) and his data did not have this problem. I am definitely going to have to play around with it and see if I can figure out exactly what is going on. Regardless, I think MB-System is a great tool and fills a very real-world need. Not everyone can afford the multi-thousand dollar price tag that comes with many of the more mainstream sonar processing software suites, and it is nice to know that there are other options available.


No comments:
Post a Comment