I recently created a shapefile in ArcGIS of my oceanic transform fault data. I started off with two separate files: a shapefile of points that simply contained a latitude/longitude and name for each fault; and a polyline shape file that contained the length measurements and the start/end points. I combined these two shapefiles in ArcMap using the "Join Data" command, and selecting to join the data based on spatial location. The result was a single polyline shapefile, that included all the original polyline attributes as well as all the related attributes (name, center lat/long) from the point file.
The problem was that the shapefile was not ordered the way I wanted it. In ArcMap you can reorder rows by ascending/descending values by double-clicking on the column header, or move columns simply by clicking on the header and dragging it over. The problem is that this only applies to your view of the shapefile attribute table, and the reordering is not actually saved to the shapefile itself. If you close out ArcMap, open a new map, reimport the shapefile, everything is back to the original order.
There is a free plugin tool for ArcGIS that is quite powerful and can solve these issues for you: ET GeoWizards. There are both free and paid versions of this toolbox, but I found the free version did exactly what I need. This toolbox is pretty impressive, and includes tools for feature translation, where shapefile objects are moved by a user-specified distance, filling holes in polygons, generalizing features, creating clusters from points, and a whole suite of other functions.
In order to reorder the columns and sort the rows in your shapefile, you can find the necessary commands under "Basic." The "Order Fields" command lets you select which fields you want to use from your original shapefile and specify the order in which they should appear. The "Sort Shapes" command lets you select which columns you want to sort the data by (you can select more than one), and whether you want them in ascending or descending order.
Another great toolbox plugin for ArcMap is Jenness Enterprises' Tools for Graphics and Shapes. If you are looking for a tool to calculate spheroidal (geodesic) length of features in your shapefile, this is the tool for you. While this toolbox includes many of the same functions as the GeoWizards plugin, it also has many unique tools as well. I have found that having both toolboxes has made working in ArcMap a much more pleasant experience. I wrote up a blogpost on the Tools for Graphics and Shapes plug-in back in 2010.
Showing posts with label ArcMap. Show all posts
Friday, May 3, 2013
Tuesday, July 6, 2010
Holy Guacamole: ArcGIS for iPhone/iPad..Free!
The title pretty much says it all!
You can view maps available from ArcGIS.com, including ones that you upload yourself. This means you can access your own GIS data. They also provide tools to digitize and measure your own routes, right on the iPhone or iPad!
Here a link to a blog post with some more info:
GeoGeek
Here is the iTunes Store link:
iTunes Store
You can view maps available from ArcGIS.com, including ones that you upload yourself. This means you can access your own GIS data. They also provide tools to digitize and measure your own routes, right on the iPhone or iPad!
Here a link to a blog post with some more info:
GeoGeek
Here is the iTunes Store link:
iTunes Store
Tuesday, January 26, 2010
Geodesic Distance in ArcMap
One of the things I like about ESRI ArcMap is the ease with which you can measure features in your data. Recently I wanted a a simple way to measure geodesic distances of some projected data. The measure tool in ArcMap, by default, measures distances in projected units in projected data, and geodesic distances only for data displayed in geographic lat/long. If you hold down the shift key while measuring a distance, Arc will calculate geodesic distances regardless of projection. What I really wanted to be able to do, however, was to be able to draw lines in a shapefile, and then have Arc calculate the geodesic distance of those lines. This is something that Arc cannot do, without you first unprojecting (or more correctly, reprojecting) your data to geographic coordinates.
Luckily, I found this: http://137.227.239.67/pigwad/tutorials/scripts/
Looks like some of the folks at ESRI got together with the USGS a designed a plug-in that will let you, among other things, calculate geodesic distances from projected data. It uses the parameters specified by your projection to unproject the data into geographic coordinates and then calculates the geodesic distance on the fly. Since it uses the semi-major and semi-minor radii that you specify in your projection, the distortion should be minimized. This tool is definitely a time saver, as it does the reprojection for you only on the data you are calculating, and enables you to keep your whole project in projected space.


Thursday, January 21, 2010
ArcMap Projection double-check
I recently posted about how I had written a python script to convert Smith/Sandwell topography data to an ARC ASCII grid. I brought my resulting data in Arc and everything appeared to be correct. It all seemed to be going quite swimmingly; until that is, I noticed that the Prime Meridian appeared to pass just off the eastern coast of Australia. Hmmmm.. Last I checked, the Prime Meridian was still in Greenwich, UK. Clearly something was wrong. In my grid image, Greenwich fell on the very edge of my map. It seems that while I can bring the data into Arc and tell it what the projection is, Arc has a hard time displaying correct Lat/Long coordinates if you range of from 0 ->360 rather than -180 -> 180. There does not seem to be a way to specify that your longitude range is 0 -> 360 versus -180 -> 180 in Arc. I find this strange and am wondering if I am simply just missing it. Anyway, since I could not figure how to make it right in Arc, I went back to my original python code.
I decided to make my grid actually go from -180 -> 180 by amending my code. I basically grabbed the western half of my grid and appended it to the beginning of my file. I then cut off the redundant data. Using Struct.unpack to decode binary data results in a tuple, which cannot be modified, so the first step is to convert to a
I had to reverse the rows before I could append the data, because the extend command places the data to be appended at the end of the row only. Once the data is correctly added, I simply reverse it back and snip off the extra. I could also just as easily grabbed the first half of the row instead (east = row[0:ncol/2]) and avoided the reversals, but this just happened to be how I worked through it first.
UPDATE: I showed Kurt my code last night and pointed out how I went about switching up the columns in my row variable. He said it was good that I figured out the two long ways, and then he showed me the one line method. Sure, you cannot really modify tuples after they have been created (e.g. no tuple.append or tuple.extend) but you can grab sections of them and switch them around like so:
Applying this method to my code, I can switch up the western and eastern halves of the line I read in from the img file simply by:
I decided to make my grid actually go from -180 -> 180 by amending my code. I basically grabbed the western half of my grid and appended it to the beginning of my file. I then cut off the redundant data. Using Struct.unpack to decode binary data results in a tuple, which cannot be modified, so the first step is to convert to a
#now unpack img data write out the ASCII file data
for j in range(nrow):
if v:
if j% 500 == 0:
print 'row:', j #print row # every 500 rows
raw_data = img.read(2*ncol)
row_tuple = struct.unpack('>'+str(ncol)+'h', raw_data)
#now move western half of data to the east
row = list(row_tuple)
east = row[ncol/2:ncol]
row.reverse()
east.reverse()
row.extend(east)
row.reverse()
corrected_row = row[0:ncol]
I had to reverse the rows before I could append the data, because the extend command places the data to be appended at the end of the row only. Once the data is correctly added, I simply reverse it back and snip off the extra. I could also just as easily grabbed the first half of the row instead (east = row[0:ncol/2]) and avoided the reversals, but this just happened to be how I worked through it first.
UPDATE: I showed Kurt my code last night and pointed out how I went about switching up the columns in my row variable. He said it was good that I figured out the two long ways, and then he showed me the one line method. Sure, you cannot really modify tuples after they have been created (e.g. no tuple.append or tuple.extend) but you can grab sections of them and switch them around like so:
In [1]: t = (1.2,3.4,5.6,7.8,9.1,10.2) In [2]: t = t[3:] + t[:3] In [3]: t Out[3]: (7.7999999999999998, 9.0999999999999996, 10.199999999999999, 1.2, 3.3999999999999999, 5.5999999999999996)
Applying this method to my code, I can switch up the western and eastern halves of the line I read in from the img file simply by:
#now move western half of data to the east row = row[ncol/2:] + row[:ncol/2]
Sunday, January 17, 2010
Converting SIO img file format to Arc ASCII grid w/ Python
Recently I have been battling with getting a SIO binary file format of predicted bathymetery (from Smith/Sandwell satellite topography data) into an Arc-friendly ASCII grid format. GMT has a nifty img2grd command which generates a netcdf of the img file; however, it takes some manual tweaking afterwards to get the coordinate bounds of the data to be Arc-happy (even if one follows img2grd grd2xyz with the -E option). I have decided I want a one-stop solution, where I could just feed in the img file and spit out an ARC ASCII grid and this means I need to write my own script. Therefore, I sat myself down this afternoon and began to teach myself Python (with some input from Kurt). Now, after just a couple hours of Googling, tweaking, and testing, I have a working Python script that does just what I need it to. It reads in an img file, and spits out a space-delimited ASCII grid file complete with the ARC header.
In order to test that I was decoding the binary properly, I wrote the first row of data out to its own little text file and used gnuplot to graph it up.
in my script I have the following:
then in terminal I call gnuplot and at the prompt type:
Certainly looks like a nice depth profile to me:
In order to test that I was decoding the binary properly, I wrote the first row of data out to its own little text file and used gnuplot to graph it up.
in my script I have the following:
for i in range(1):
row = struct.unpack('>'+str(ncol)+'h',img.read(2*ncol))
for depth in row:
o.write(str(depth)+"\n")
print "\n"
then in terminal I call gnuplot and at the prompt type:
plot 'filename' with l
Certainly looks like a nice depth profile to me:
Monday, March 23, 2009
How to create an outline of your data in ArcMap
Recently I had some XYZ data gridded up in ArcMap, and I wanted to create a simple outline of it. I could not, for the life of me, figure out how to do it, save digitizing the entire thing myself. Luckily, someone showed me a very valuable trick, and I now know there is a quick way to do it, though this method is by no means straight forward:


- create a raster of your data. Whether you chose natural neighbors, an IDW grid, whatever, does not matter. Any resolution that will not exaggerate you data coverage will work.
- use raster calculator to convert this grid to an integer grid. You can use Raster Calculator under the Spatial Analyst tool and simply multiply your grid by 0. You need to put your expression between parentheses, with an "int" in front. For example: [mb_int_grid] = int([mb_grid] * 0)
- Also under Spatial Analyst, use the Convert Raster to Features to convert your integer grid to a polygon.
- You can now alter your polygon symbology to give you a nice outline.
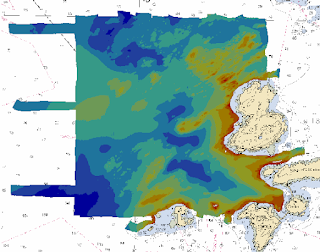
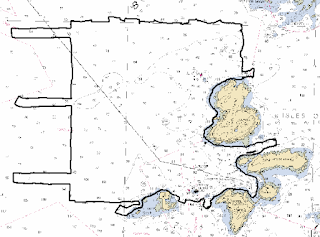
Below you can see my original gridded data and the resulting outline.


Subscribe to:
Posts (Atom)